
In a companion post we described match-between-runs in DDA: how it fills the missing values that arise when the instrument never gets around to fragmenting a peptide, and why the field has been uneasy about it. The short version is that in DDA a transfer has to be taken partly on trust. The peptide is missing from a run precisely because it was never fragmented there, so no fragment spectrum exists to re-examine. The best available move is to find an MS1 peak of the right mass at the predicted time and inherit the identity and score from a run that did identify it.
We build a lot of safeguards around that. But the limitation is a property of the acquisition, not of the algorithm — and it disappears entirely when the data are acquired by DIA.
DIA: Fragment Everything, Decide Later
Section titled “DIA: Fragment Everything, Decide Later”Data-independent acquisition makes a different bargain.
Instead of choosing precursors in real time, DIA divides the mass range of interest — say 400 to 1000 m/z — into a fixed set of windows. In each cycle the instrument takes everything in the first window and fragments all of it at once, recording a single composite MS2 spectrum; then the second window, then the third, across the whole range. Then it starts the cycle again, continuously, from the beginning of the gradient to the end.
The name says it: what gets fragmented does not depend on what the instrument just saw. The schedule is fixed in advance and identical in every run. There is no top-N list and no competition for slots.
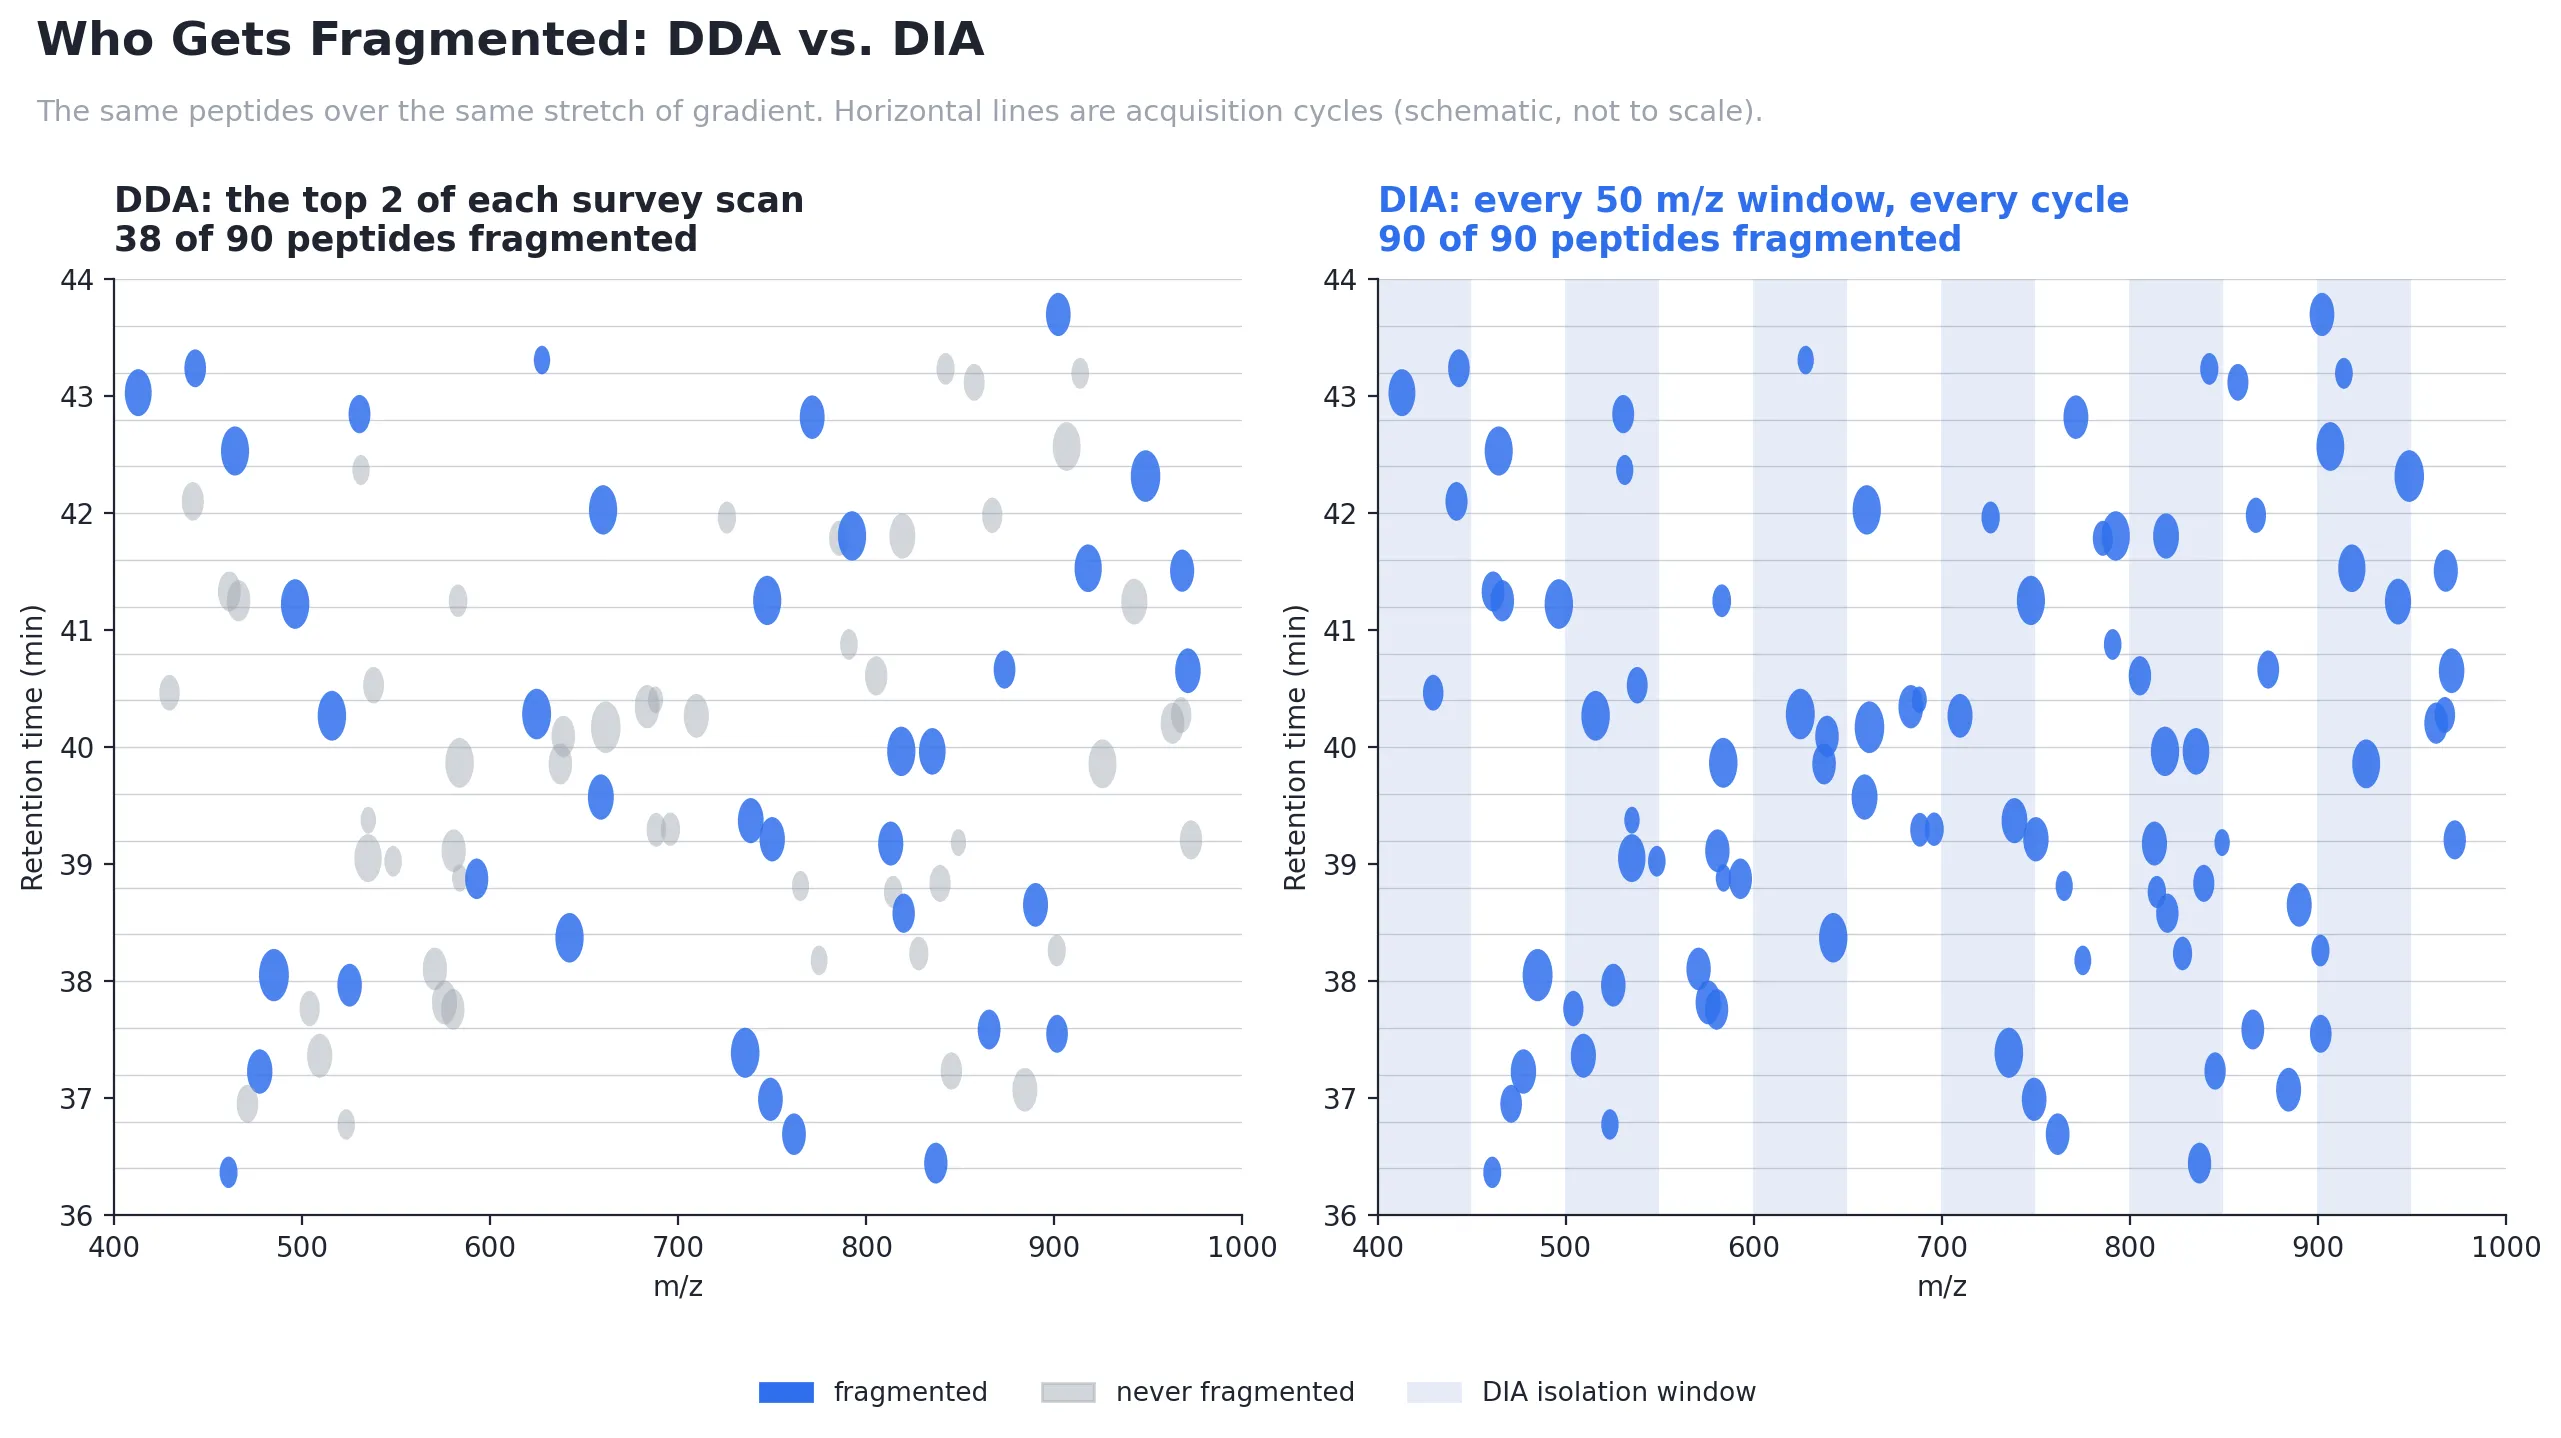
Figure 1. Who gets fragmented. A schematic of the same peptides over the same stretch of gradient. DDA fragments only what wins each survey scan; DIA fragments every window on every cycle, so every peptide is covered.
The cost is that the MS2 spectra are chimeric — each contains the fragments of every peptide that was in that window at that moment, superimposed. You cannot hand such a spectrum to a search engine and ask what peptide it is, because it is many peptides at once. Untangling that is the central difficulty of DIA analysis, and it is why DIA methods work with chromatograms: for a candidate peptide you extract the signal over time for each of its expected fragment masses, and ask whether those traces rise and fall together, in the same shape, at the same moment. Co-elution of the right fragments is the evidence.
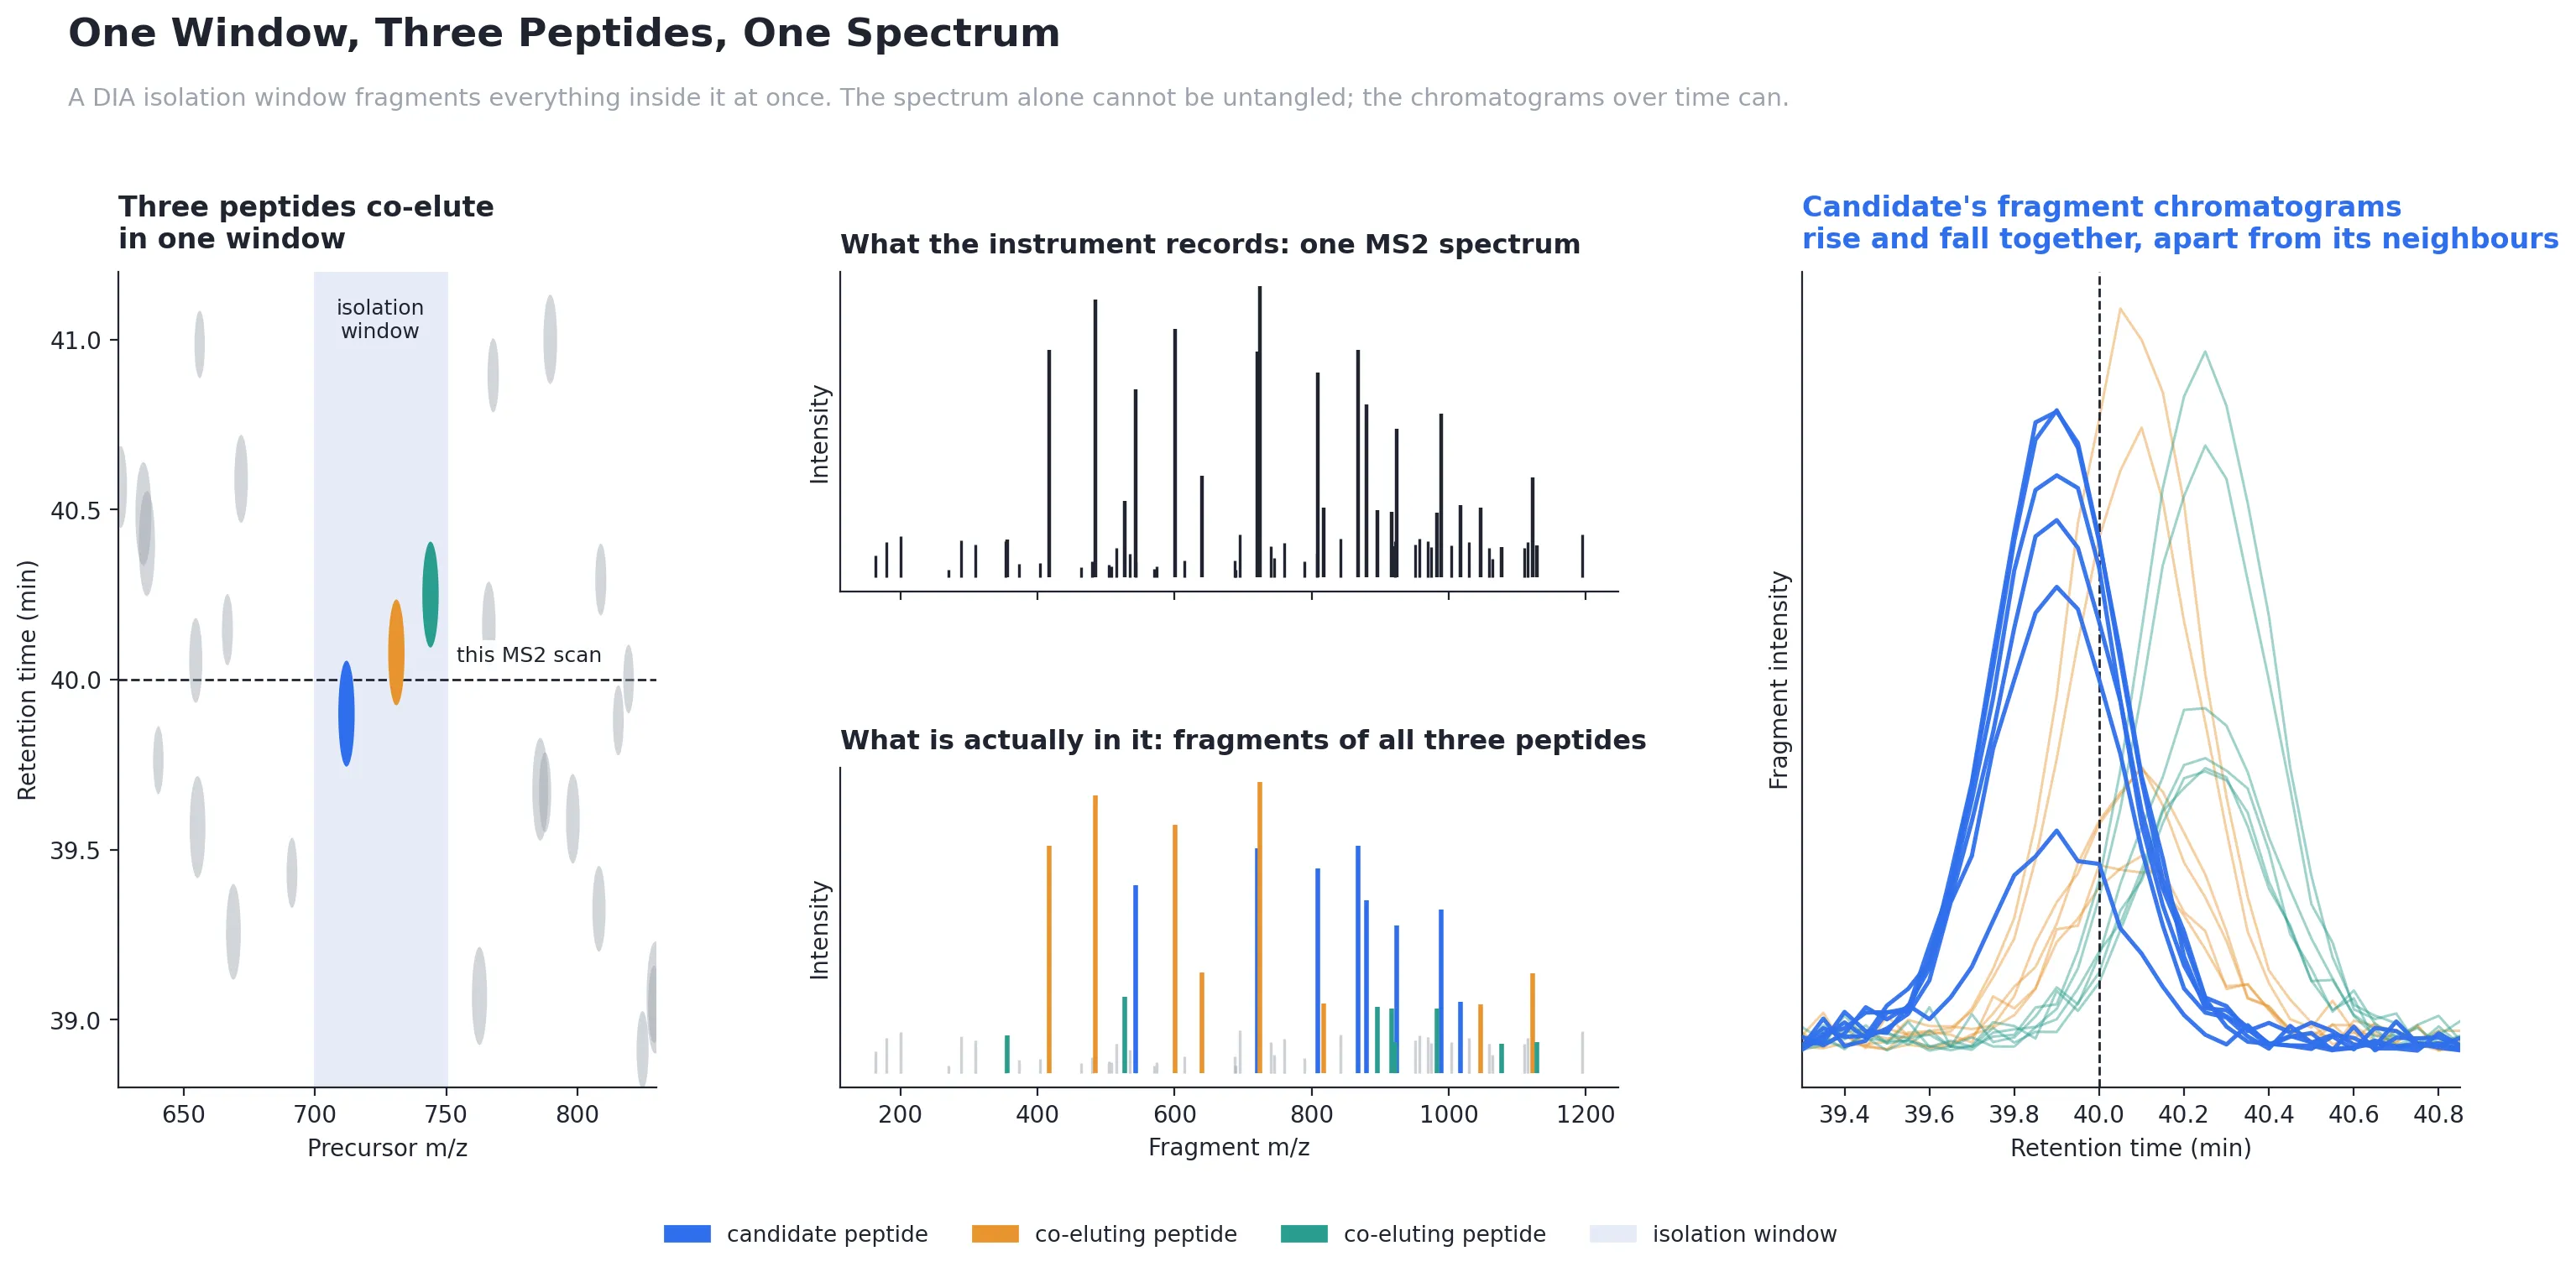
Figure 2. One window, three peptides, one spectrum. A schematic. The recorded spectrum mixes the fragments of everything in the window; tracing each fragment over time separates the candidate from its neighbours.
Here is the consequence that matters:
In a DIA run, every peptide in the scanned mass range was fragmented, on every cycle, for the entire gradient. The fragment evidence for a peptide exists in the file whether or not anyone ever identified it.
A peptide “missing” from a DIA run is missing in a bookkeeping sense, not a measurement sense. Nobody picked out and scored a peak group for it. But the raw material that would confirm or refute it was recorded, and is sitting in the file.
A Transfer Becomes a Hypothesis
Section titled “A Transfer Becomes a Hypothesis”If the evidence is already there, match-between-runs does not have to borrow a score. It can go and earn one.
This changes what a transfer is. In DDA a transfer is necessarily a conclusion imported from another run. In DIA it can be a hypothesis about this run — “the cohort says peptide X should be here, at roughly this time; is it?” — and that question can be answered with this run’s own data. The cohort decides only where to look. What we find when we look there decides whether the peptide is reported.
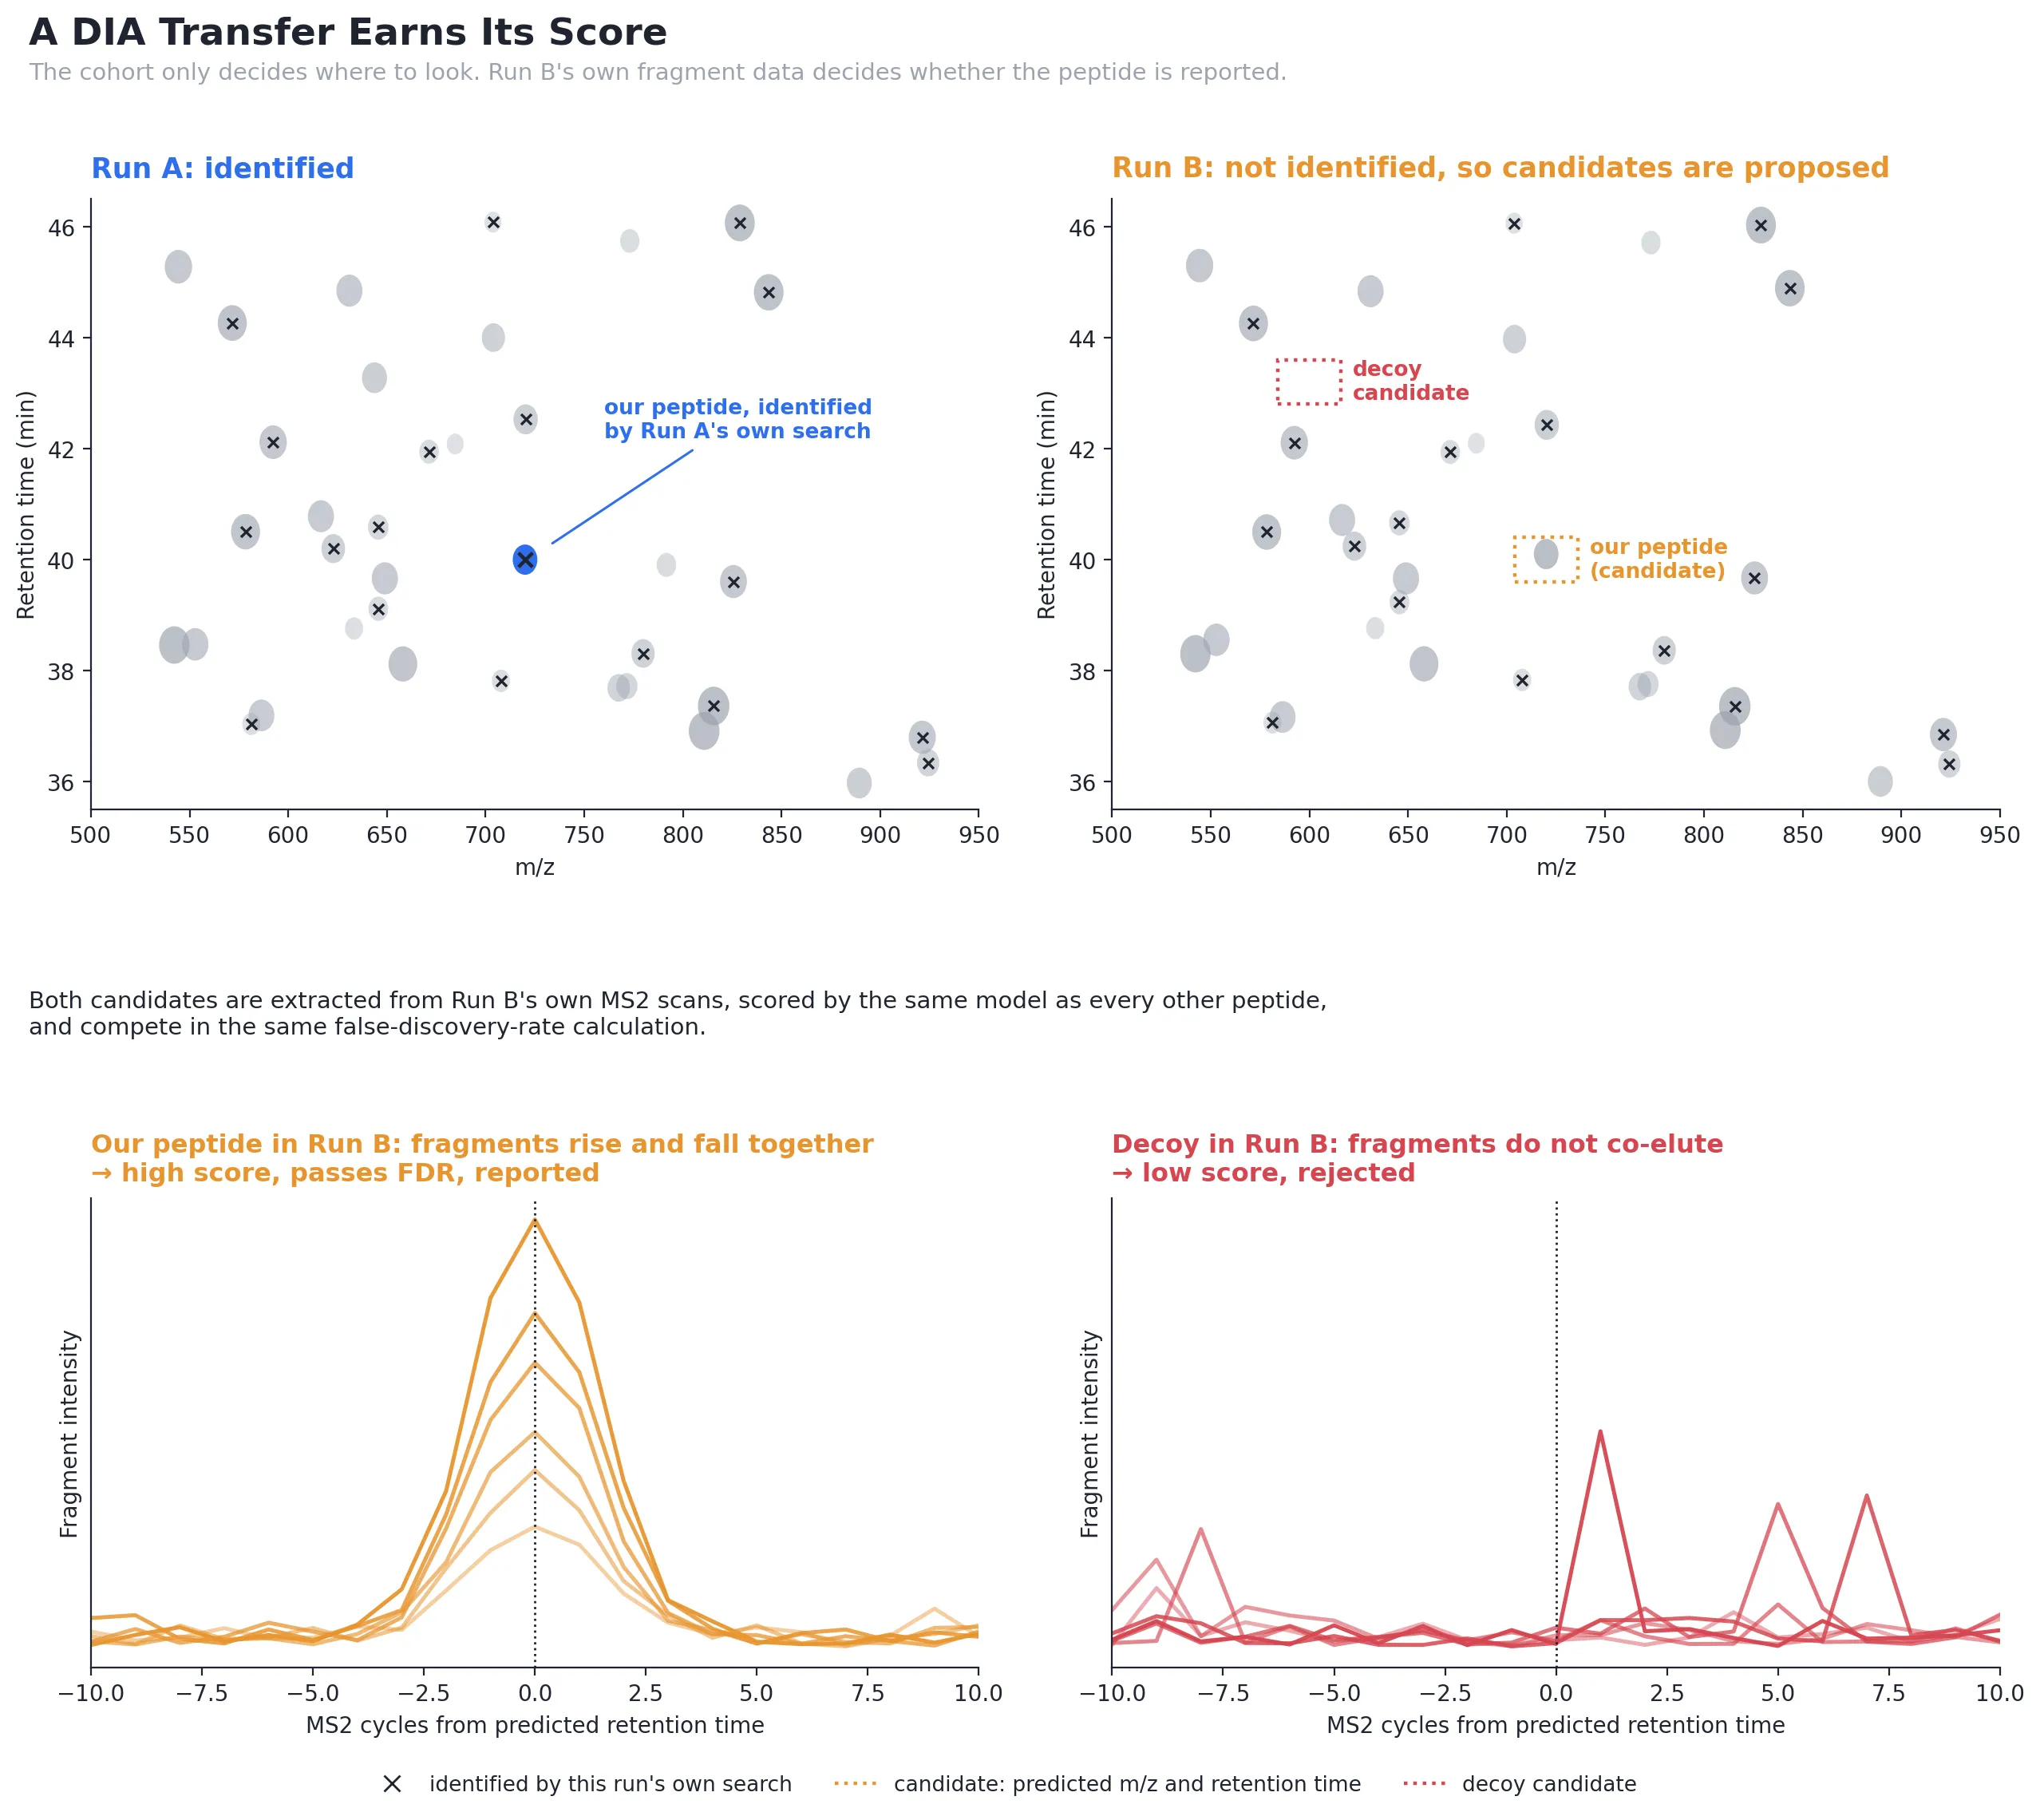
Figure 3. A transfer earns its score. A schematic. The candidate and a decoy are both checked against Run B’s own fragment data; only the one whose fragments actually co-elute is reported.
Proposing the hypotheses. After a first pass of identification across the cohort, we find peptides confidently identified in some runs and absent from others, and align retention times run-to-run with a robust, outlier-trimmed fit. Each candidate carries a predicted retention time, a tolerance window, and — on instruments that measure it — an expected ion mobility. Decoy candidates are proposed alongside real ones. As in DDA, a peptide must have been identified in several source runs before it is eligible to travel.
This stage is deliberately permissive. The goal is not to be right yet, but to avoid missing anything, because the filtering that follows is far stricter than any candidate-selection rule.
Going back to the data. For each candidate, in the run that missed it, we locate the acquired MS2 scans covering its precursor mass around the predicted retention time, and extract chromatograms for its expected fragment ions — with the same extraction code, mass tolerances and mobility handling as the ordinary search. This is not a special MBR measurement; it is the identical operation the search performs on every peptide it reports.
Rescoring with the same model. Those chromatograms go through the same DIA scoring model that scored every other identification in the run. Not a separate transfer classifier, not a recalibrated version of a borrowed score. A transferred peptide’s score therefore means exactly what any other score means.
Competing in the same error-rate calculation. Finally, transferred and ordinary candidates — real sequences and decoys alike — go into a single false-discovery-rate calculation. Because decoy transfers were proposed and scored under precisely the same rules as real ones, they measure how often this procedure produces a convincing-looking result by chance. There is no separate, more permissive error rate for transfers. A transfer that survives cleared the same bar, against the same decoys, as everything else.
Transfers are then quantified by the ordinary per-run quantification, in the same pass as everything else. Each precursor’s intensity comes from its own signal in its own run — which means turning match-between-runs on does not change any of the numbers you already had. It only adds rows.
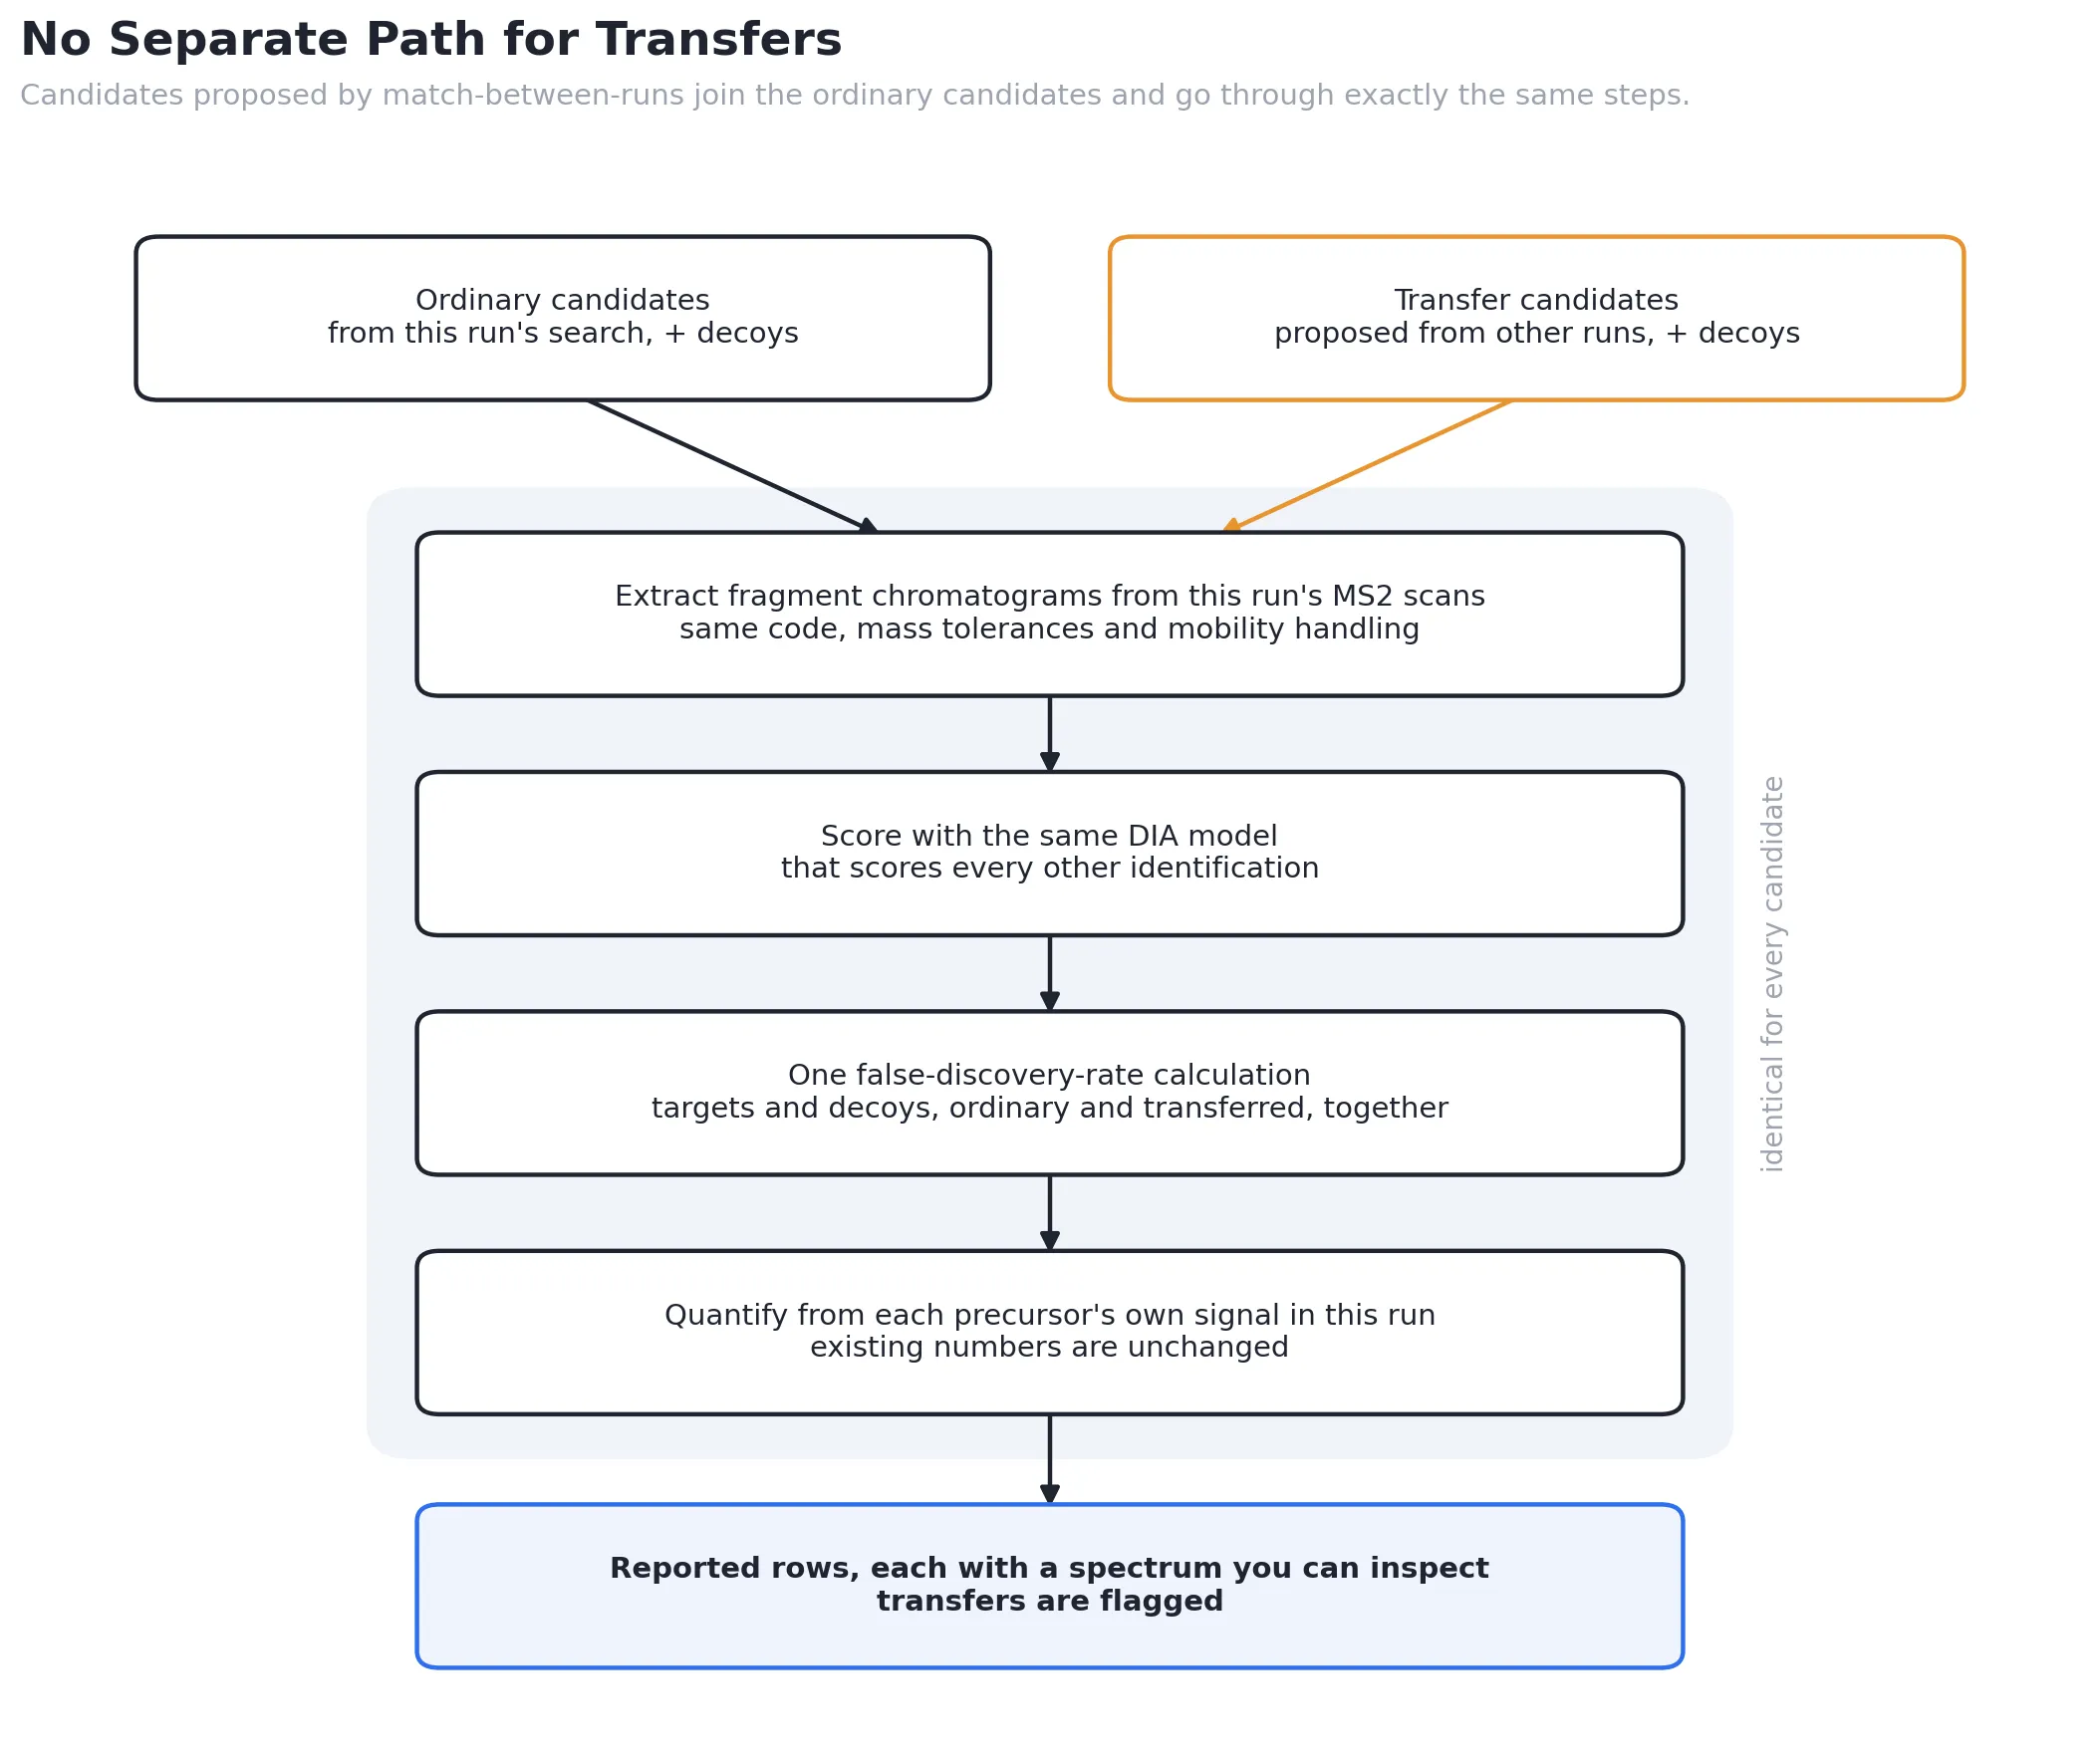
Figure 4. No separate path for transfers. Transfer candidates join the ordinary candidates before extraction and share every step after it.
What This Looks Like on Real Data
Section titled “What This Looks Like on Real Data”Here is a single peptide from a ProteoBench cohort of twelve ZenoTOF DIA runs. It was identified directly in one run and recovered by match-between-runs in another. Both panels show that peptide’s actual data.
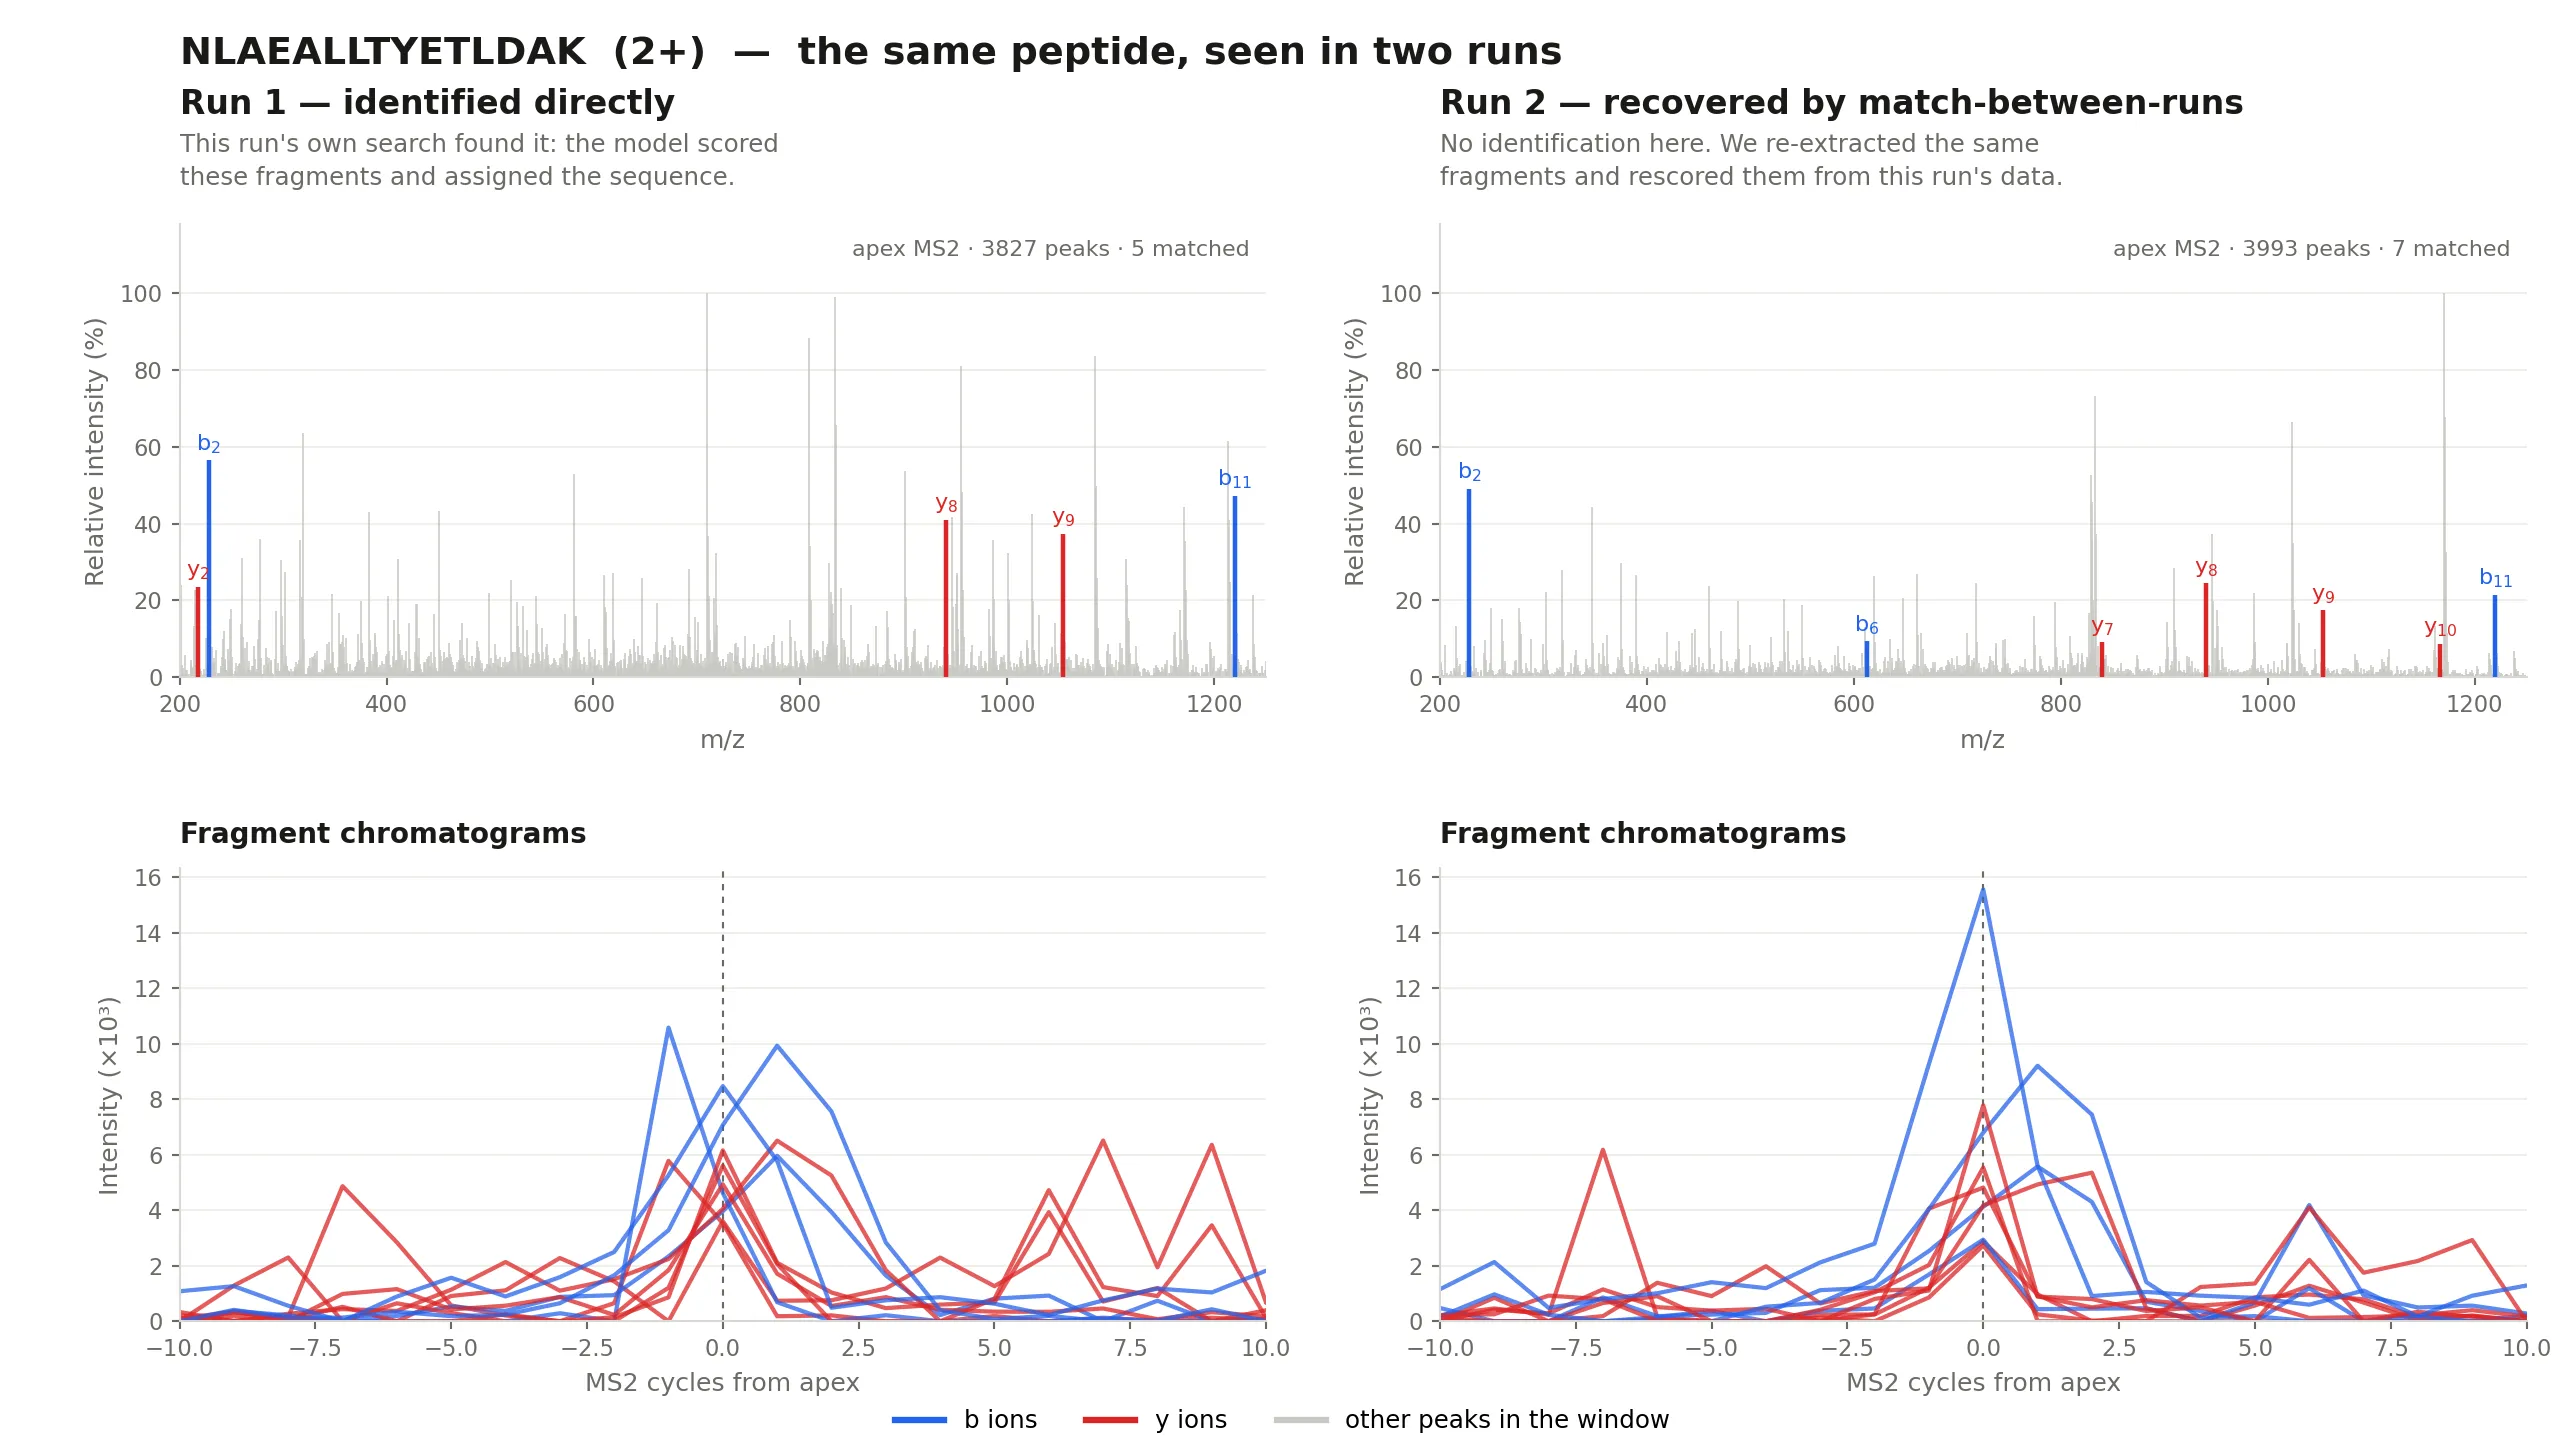
Figure 5. The same peptide, seen two ways. NLAEALLTYETLDAK (2+), from the human protein YME1L1, in two runs of a 12-file ProteoBench ZenoTOF DIA cohort. Left: a run whose own search identified the peptide. Right: a run with no identification for it, where match-between-runs proposed it and the peptide was recovered. Top row: the apex MS2 spectrum, with the peptide’s b and y fragment ions marked; grey peaks are everything else co-isolated in the same window — roughly 3,900 peaks per spectrum, which is what “chimeric” means in practice. Bottom row: the extracted fragment chromatograms the model actually scored, over the MS2 cycles either side of the apex, on a shared intensity axis.
Two things are worth pointing out.
The first is that the recovered peptide is not a weaker object than the directly identified one. In this instance the transferred run matched slightly more of the peptide’s fragments (7 versus 5) and shows a tighter, better-resolved co-elution profile at the apex. That is not cherry-picking a flattering case so much as an illustration of the underlying point: whether a run’s search happened to pick up a peptide is partly a matter of which candidates were generated and scored, not only of how good the signal is. The signal was always there. The right-hand run simply had not been asked the question.
The second is that this figure could not be drawn for a DDA transfer. There would be no apex spectrum to show and no fragment chromatograms to compare — only an MS1 peak and a score copied from elsewhere.
Every Result Keeps Its Spectrum
Section titled “Every Result Keeps Its Spectrum”That is the practical difference, and it goes beyond one figure.
Because a DIA transfer is produced by extracting and scoring real signal, it carries the same artifacts as any other identification: the MS2 scans it was anchored to, an extracted fragment chromatogram, a model score, and a q-value. Nothing about it is a pointer to a different run.
So in the Tesorai report, a recovered peptide is not a special row you have to take on faith. Click it and you get the same annotated fragment-chromatogram view as any other PSM — the individual fragment ions, their traces over time, the co-elution profile the model scored. You can look at the evidence and form your own opinion, exactly as you would for a peptide the search found unaided. Recovered rows are also flagged, so you can filter to them, report on them, or exclude them at will.
Every result in a DIA search — recovered by match-between-runs or not — is backed by a spectrum you can audit.
What It Recovers
Section titled “What It Recovers”The cleanest comparison is a cohort of ten human plasma DIA runs, running the identical job twice with match-between-runs as the only difference. The appendix adds a recovery test on peptides we hid on purpose and results on three instrument platforms.
| Metric | MBR off | MBR on | Δ |
|---|---|---|---|
| PSMs (Σ per file) | 254,747 | 279,749 | +9.8% |
| Modified peptides (Σ per file) | 206,127 | 227,055 | +10.2% |
| Protein groups (Σ per file) | 39,674 | 45,287 | +14.1% |
| Precursors seen in every file | 14,265 (32.2%) | 17,424 (39.2%) | +7.0 pp |
| Quant-matrix fill | 57.5% | 63.0% | +5.5 pp |
| Distinct precursors (cohort union) | 44,313 | 44,401 | +0.2% |
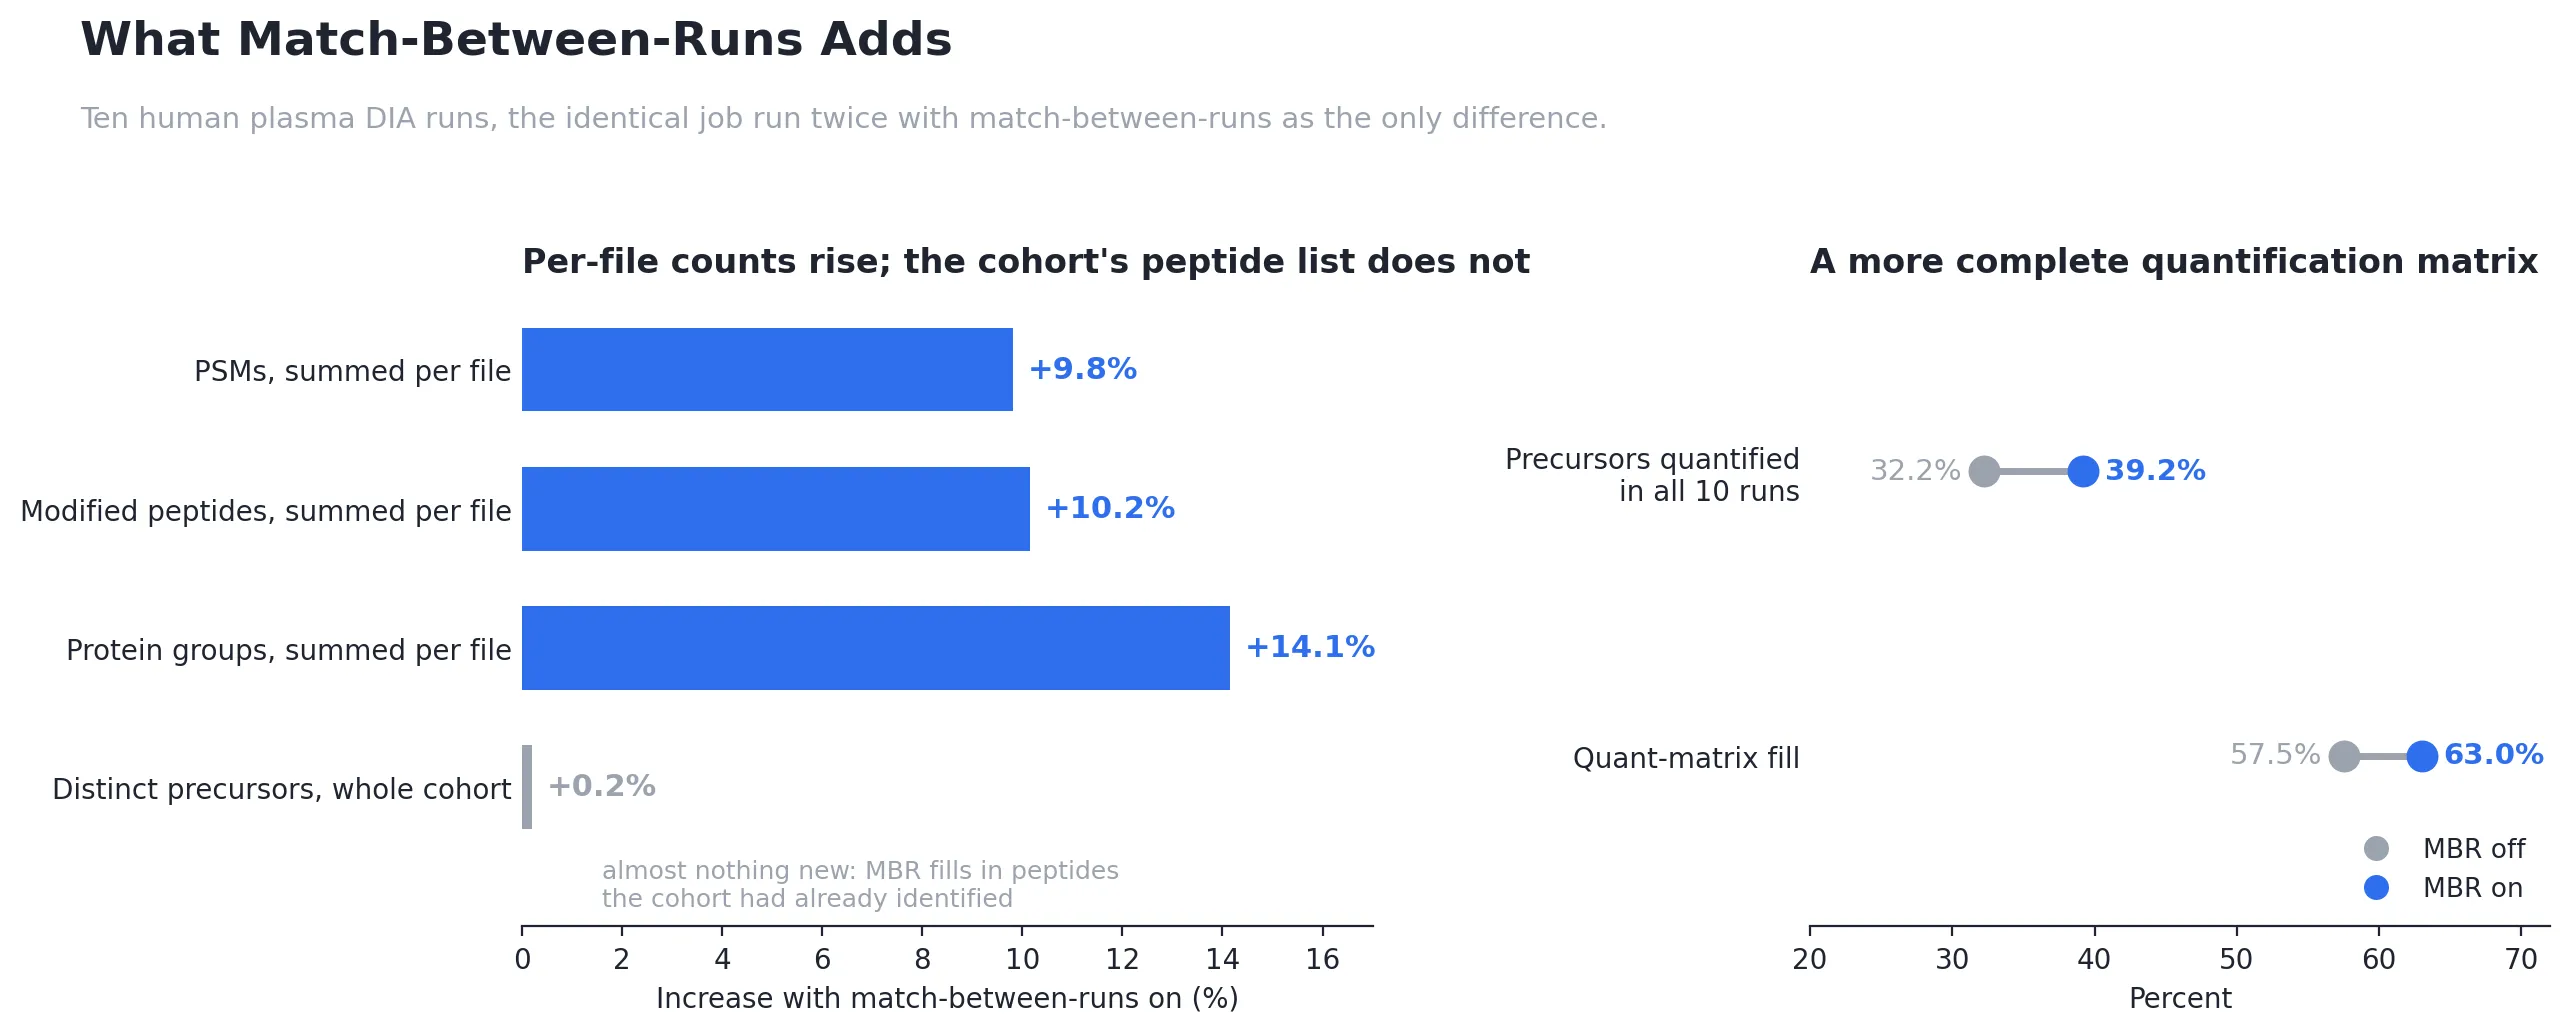
Figure 6. What match-between-runs adds. The table above, plotted.
The most informative row is the last. Counted per run, identifications rise about ten percent. But the cohort-wide list of distinct precursors barely moves — up 0.2%. Match-between-runs is not adding peptides the experiment had never seen; it is filling in peptides the cohort had already identified somewhere. That is exactly the behaviour you want, and — as the two-proteome literature discussed in the companion post shows — it is the behaviour that is hardest to guarantee when transfers are not independently re-verified.
The completeness rows are where this shows up in daily use. The fraction of precursors quantified in all ten runs rises from 32.2% to 39.2%: seven percentage points more of the matrix available to a paired statistical test without imputing anything.
The Takeaway
Section titled “The Takeaway”The interesting thing about DIA is not that it produces more data than DDA. It is that the data for the peptide you didn’t identify is already in the file.
Match-between-runs was designed for an acquisition mode where that was not true, and carries the compromise this forced: trust the other run, because this one has nothing further to say. In DIA, this run has plenty to say. We ask it — with the same extraction, the same scoring model, and the same error-rate control that every other identification in your job had to pass — and we keep the answer, spectrum and all, so you can check it yourself.
Match-between-runs for DIA is available now in the Tesorai platform. Enable it when you submit a multi-file DIA search.
Appendix: Further Validation
Section titled “Appendix: Further Validation”Recovering peptides we know are there
Section titled “Recovering peptides we know are there”A comparison with match-between-runs off and on shows how much it adds, but not how much it misses. To measure that, we need peptides we know are present in a run and that the run’s own search did not report. So we made some.
In an Astral DIA run we hid 7,307 precursors that had been confidently identified (q ≤ 0.01) and were also seen in at least four other files, then ran the real match-between-runs pipeline and counted how many came back, stage by stage.
| Stage | Recall |
|---|---|
| Nominated as a transfer candidate | 100.0% |
| Anchored, and fragment chromatograms extracted | 100.0% |
| Accepted at 5% FDR | 96.0% |
| Accepted at 1% FDR | 91.7% |
Four things stand out:
- Recovery does not depend on abundance. Recall is 94.8% in the faintest decile of precursors and 97.3% in the brightest.
- Nothing is lost before scoring. Every hidden precursor was proposed and extracted; all of the loss happens when the evidence is scored and put through the error-rate calculation.
- Most misses are retention-time misses. Of the 609 precursors not recovered, 68% were looked for at the wrong retention time.
- They cluster at the start of the gradient. The first 30% of the gradient holds 5.7% of the hidden precursors but 55% of the misses. There, the retention-time alignment is off by 0.41 minutes on average, against 0.015 minutes over the rest of the run. Outside that stretch, recall is 96%.
This test measures sensitivity: whether a peptide that is really present gets recovered. It does not measure how often a peptide that is absent gets reported. That is the job of the decoy candidates in the shared false-discovery-rate calculation.
Across instruments
Section titled “Across instruments”We also ran match-between-runs on ProteoBench DIA data from three instrument platforms. Here, each job is split into the rows the search identified natively and the rows added by transfer.
| Instrument | Files | Native PSMs | Transfers | Precursors in every file (native → with MBR) | Quant-matrix fill (native → with MBR) |
|---|---|---|---|---|---|
| Astral | 6 | 674,497 | 36,590 | 66,091 → 85,188 | 60.4% → 63.7% |
| Bruker diaPASEF | 6 | 526,436 | 29,126 | 57,747 → 72,919 | 65.9% → 69.5% |
| ZenoTOF | 12 | 1,112,073 | 184,545 | 47,176 → 79,250 | 49.0% → 57.1% |
Transfers add 5.4% (Astral), 5.5% (Bruker) and 16.6% (ZenoTOF) to the PSM count, and the number of precursors quantified in every run rises by 29%, 26% and 68%. The larger gain on ZenoTOF follows from cohort size: with twelve files rather than six, more precursors meet the requirement of having been identified in several source runs.
These are splits within a single job rather than separate runs with the feature off and on. Because natives and transfers are ranked together in one false-discovery-rate calculation, the native column is close to, but not identical with, what a run without match-between-runs would report. The plasma cohort above is the true off-versus-on comparison.