Mass spectrometry (MS)-based proteomics is powerful for biological discovery, mapping protein abundance changes across conditions, treatments, or time points. This differential analysis is fundamental to understanding cellular responses, finding biomarkers, or detailing pathways.
A common output from initial data processing is the “protein table” – listing identified proteins and their estimated relative quantities. Many researchers then apply familiar statistical tests, like the t-test, directly to these protein quantities to find significant changes. While widely used, this workflow relies on data processing steps and assumptions that significantly influence results. Let’s explore key limitations often hidden “under the hood.”
1. From Peptides to Proteins: The Aggregation Challenge
Section titled “1. From Peptides to Proteins: The Aggregation Challenge”Mass spectrometers quantify peptides, not whole proteins. To gain protein-level insights, these peptide measurements must be aggregated—a process that inherently loses valuable information. Peptides from the same protein can yield vastly different signal intensities due to varying detection efficiencies, making simple summaries difficult. Various aggregation methods exist, each with trade-offs:
- Summing Intensities: Simple addition, but sensitive to peptide variability and outliers.
- Top 3 Peptides: Uses the 3 most intense peptides, aiming for reliable between-sample comparisons, but loses information from all other peptides.
- iBAQ: Normalizes summed intensity by observable peptides, estimating within-sample relative abundance.
The chosen aggregation method directly impacts protein quantity estimates and differential analysis results. Understanding which method was applied is therefore vital for interpretation.
2. Applying T-Tests to Summarized Data: Information Lost
Section titled “2. Applying T-Tests to Summarized Data: Information Lost”Applying standard t-tests directly to the aggregated protein table has limitations:
- Loss of Peptide-Level Detail: Aggregation hides the consistency (or inconsistency) of measurements across different peptides from the same protein. Was a change driven by most peptides or just one outlier? The aggregated value doesn’t say.
- Statistical Assumptions: T-tests assume normality and equal variances. Aggregated protein data might not meet these assumptions, potentially compromising p-value reliability.
3. Peptide Reliability Matters
Section titled “3. Peptide Reliability Matters”Peptide identifications have confidence scores. Simple aggregation often ignores these, allowing low-confidence, potentially incorrect identifications to introduce noise and bias into protein quantification.
A Real-World Example: Insights from Parkinson’s Disease Proteomics
Section titled “A Real-World Example: Insights from Parkinson’s Disease Proteomics”These challenges are illustrated by results from a proteomics study (PXD030142) analysing postmortem prefrontal cortex tissue from 12 late-stage Parkinson’s disease (PD) individuals versus 12 controls.
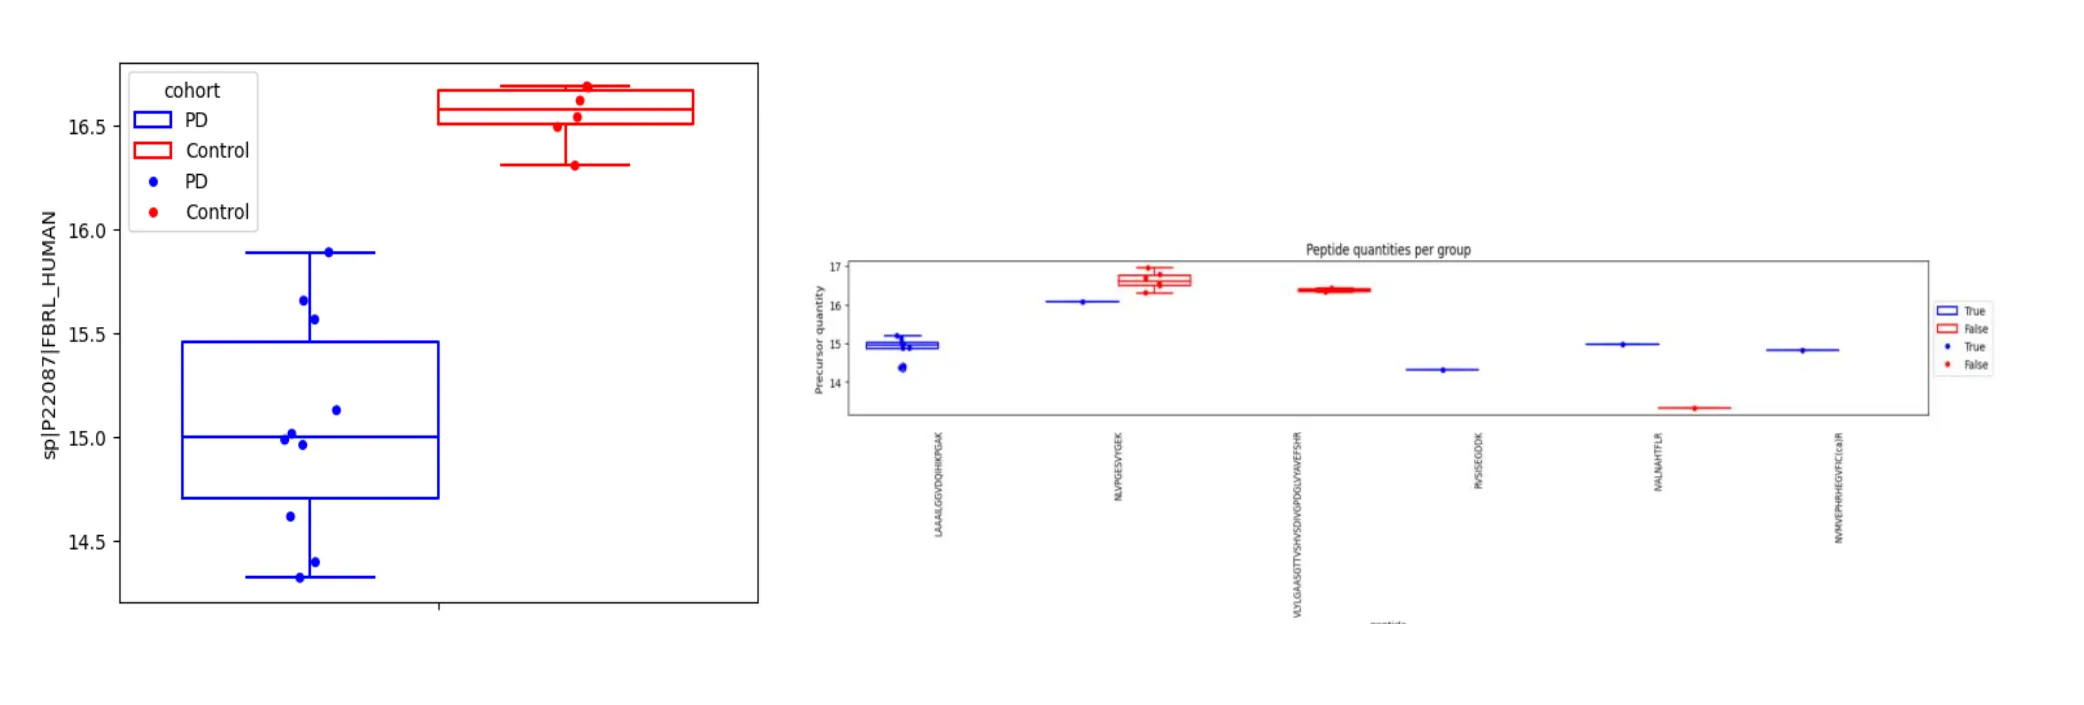
Figure 1. FBRL differential results between PD and controls Left: protein-level quantities (box-plot), obtained with the iBAQ method. Right: peptide-level quantities. Each box plot shows quantification results for a given peptide.
Analysis of the protein FBRL using a standard protein-level t-test on aggregated iBAQ quantities (Figure 1, left panel) initially suggested a highly significant difference (p=0.000094). However, this was misleading. FBRL identification relied on only 6 distinct peptides total, with just one detected in more than a single PD sample. This sparse evidence made protein-level quantification unstable; the significant t-test was driven by an extremely low value in one PD sample, a pattern clear from the underlying peptide quantities (Figure 1, right panel). In contrast, a peptide-level differential analysis tool integrating peptide evidence correctly found FBRL non-significant (q=0.3973). This FBRL case shows how protein-level statistics on aggregated data can mislead with sparse support (Figure 1, left panel), while assessing peptide-level consistency offers more robust evaluation (Figure 1, right panel).
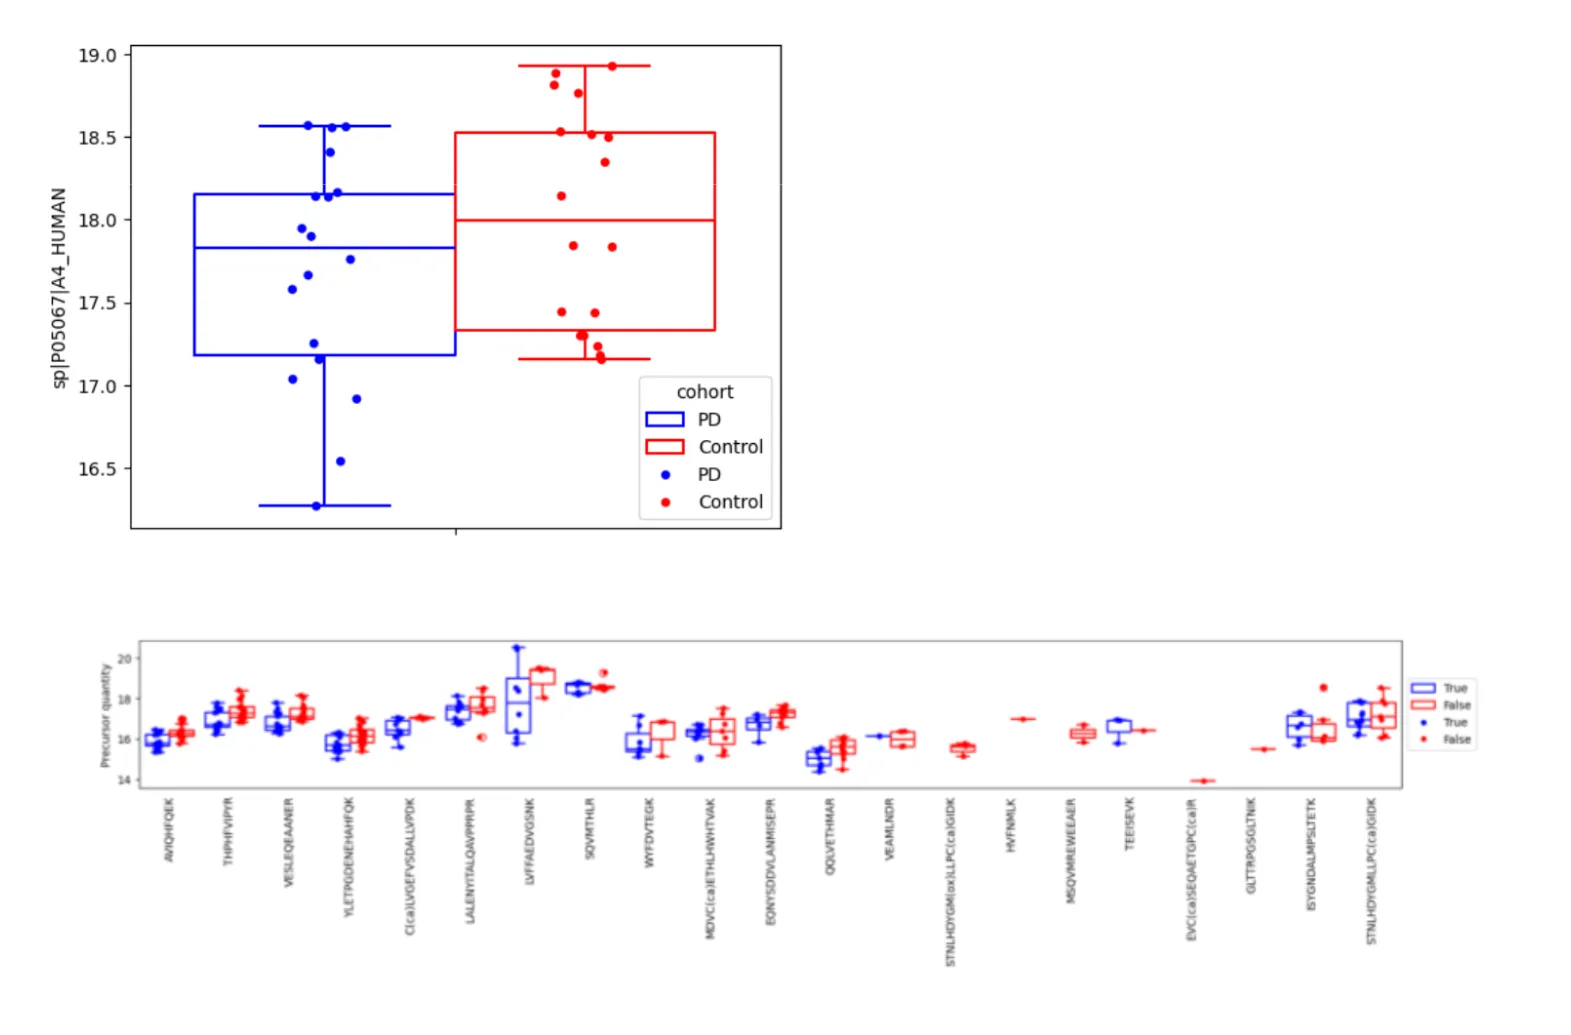
Figure 2. APP differential results between PD and controls Top: protein-level quantities (box-plot), obtained with the iBAQ method. Bottom: peptide-level quantities. Each box plot shows quantification results for a given peptide.
Conversely, the analysis highlighted benefits of approaches using source data more directly. To that end, we built TesoraiDifferential, designed to combine peptide-level information with the experimental design, avoiding information loss from pre-aggregation. Using TesoraiDifferential, we found that Amyloid Precursor Protein (APP) was present in significantly reduced quantities in PD samples. Detecting APP changes is relevant given its known involvement in neurodegenerative processes, including Parkinson’s Disease. This finding was supported by robust data: APP quantification used 21 distinct peptides, most providing measurements in 5+ samples per group, indicating consistent detection (Figure 2, bottom panel). This consistent peptide signal allowed TesoraiDifferential to detect a small-yet-significant signal, even though group separation at the aggregated protein level seems less obvious visually (Figure 2, top panel). Strikingly, the conventional protein-level t-test on aggregated iBAQ data (Figure 2, top panel) failed to find APP significant, likely because aggregation obscured consistent peptide-level changes, losing statistical power.
Conclusion: Look Beyond the Surface
Section titled “Conclusion: Look Beyond the Surface”The protein table is an essential starting point, but it’s a summarized view. Understanding the impact of variable peptide detectability, aggregation choices, information lost in simple statistical summaries, peptide reliability, and shared peptides is crucial for robust interpretation. As examples from neurodegenerative disease research show, comparing standard methods with peptide-level analyses like TesoraiDifferential reveals potential pitfalls (false positives like FBRL) and missed opportunities (false negatives like APP). A deeper awareness of how protein tables are constructed, and leveraging tools that retain more peptide-level information, ultimately allows for more confident and insightful conclusions from powerful proteomics experiments.